Educators contribute to the profession.
During my 10-week practicum I was afforded a great deal of space and support to build my own lessons and develop my own ideas from my coaching teachers. Two of my placements were teaching Science 9 and my coaching teacher provided me with some short fill-in-the-blank notes that contained content from each of the units covered in science 9—these notes were co-developed by my coaching teacher and another junior science teacher in the school. What these notes did for me was to provide a base, or skeleton, of progression for unit planning—like a roadmap. Because I had been given a simple roadmap, I was able spend much of my time focusing on creating interesting lessons, activities, and assessments that followed the provided trajectory. As a new teacher who is inexperienced at teaching most grade level curricula, the sharing of resources had a significant impact on the way I focused my time, and as such, I developed countless lessons, activities, projects, and methods for assessment this practicum. To give back to my coaching teacher(s) and others, I was sure to share back many lessons and resources I created during my 10-week practicum; below is an example.
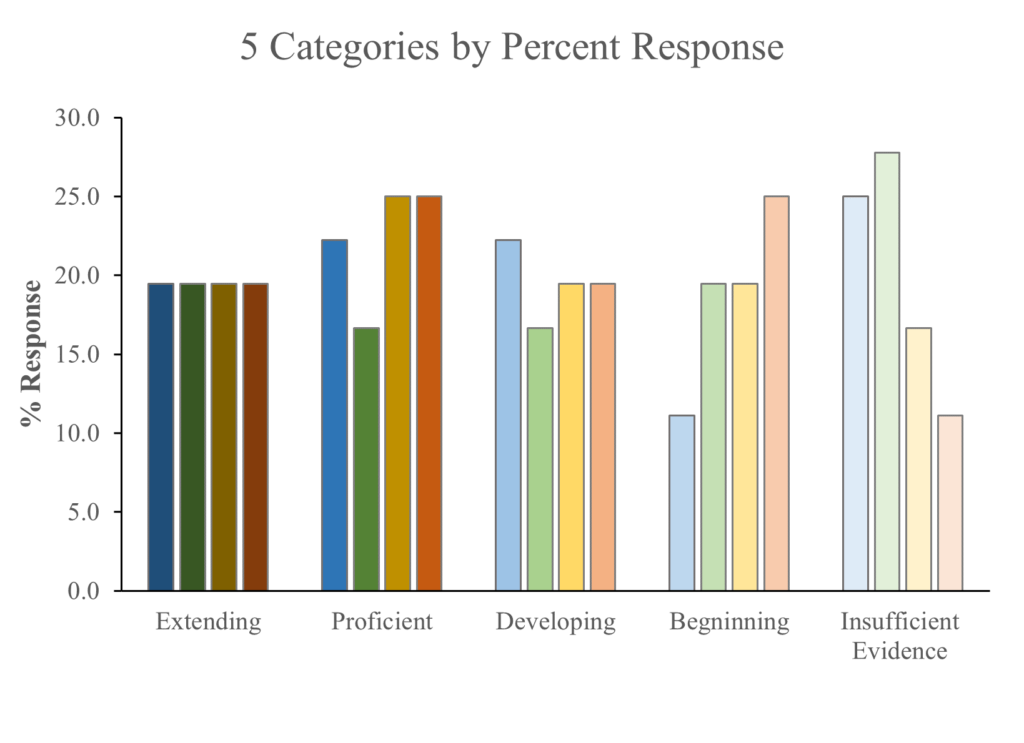
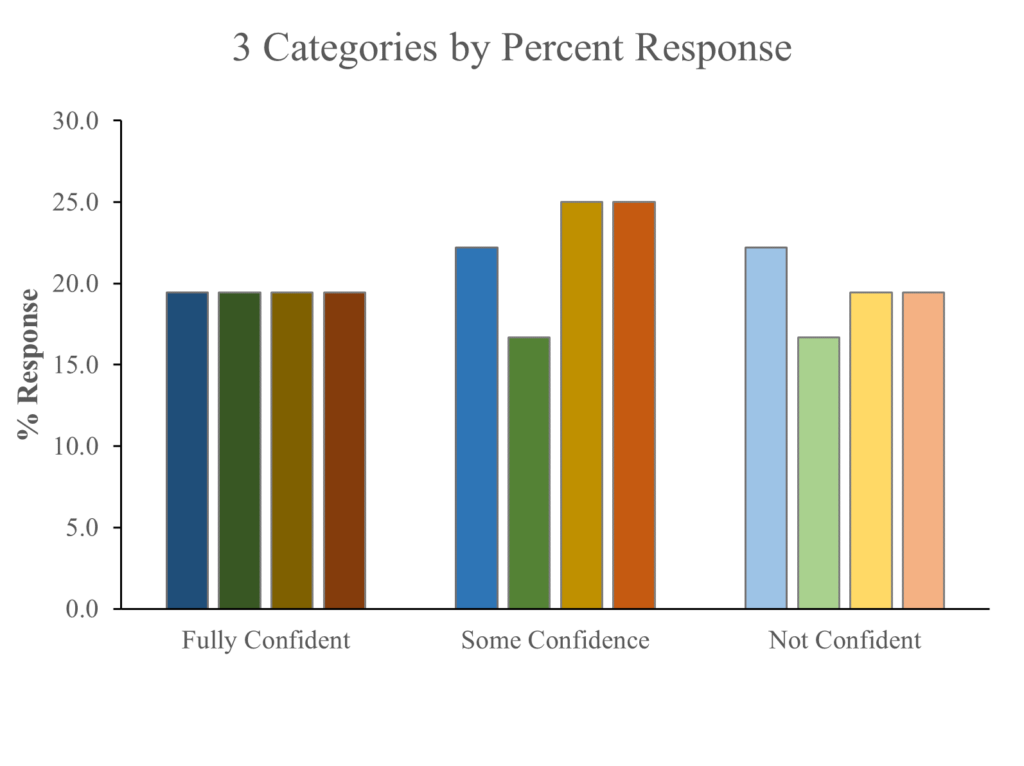
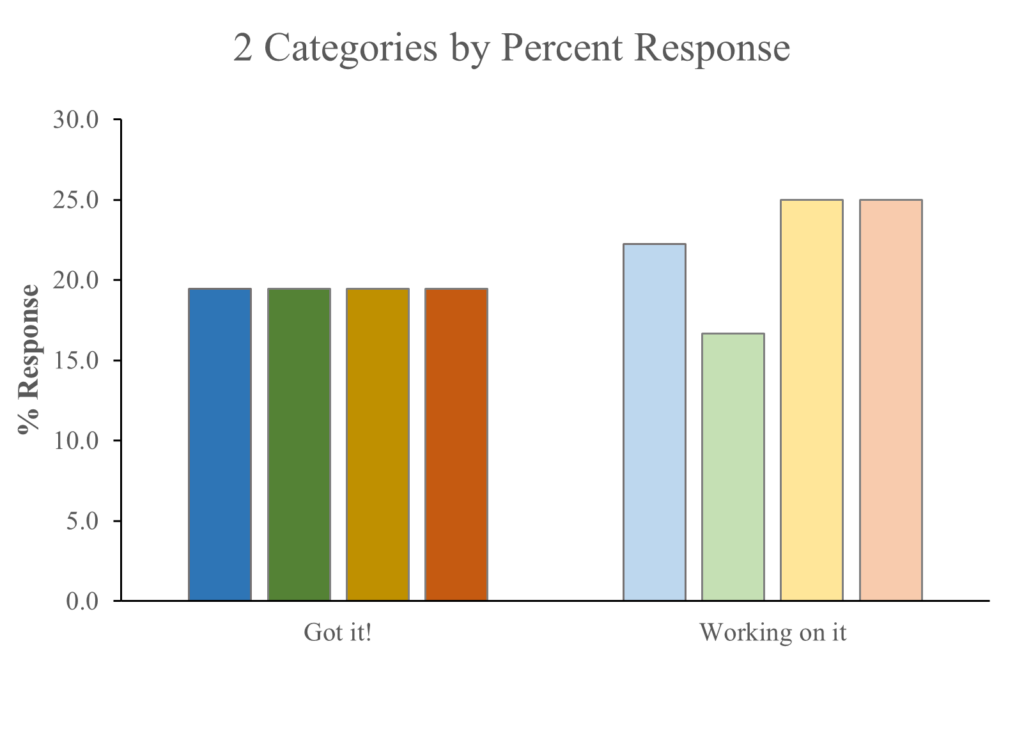
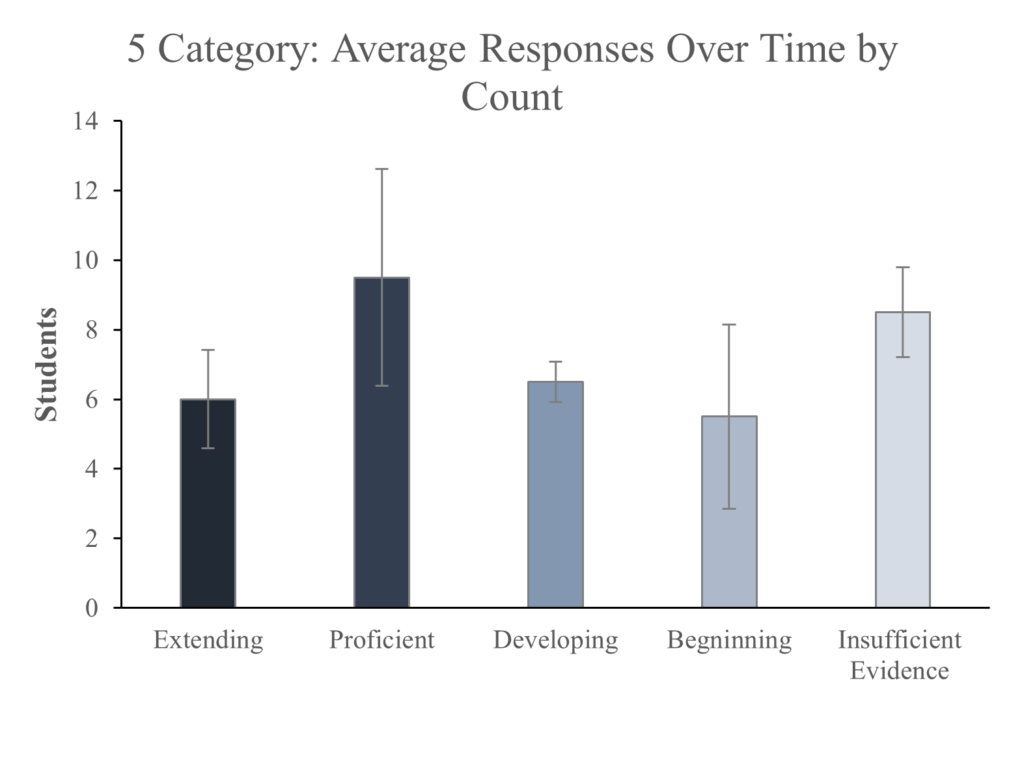
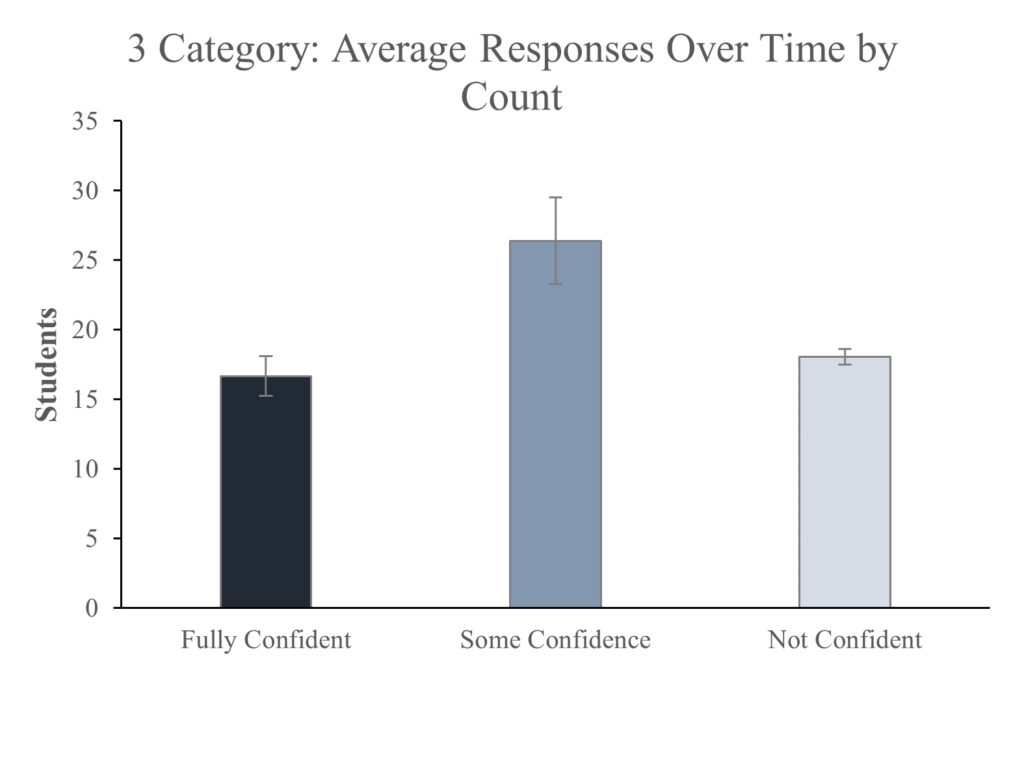
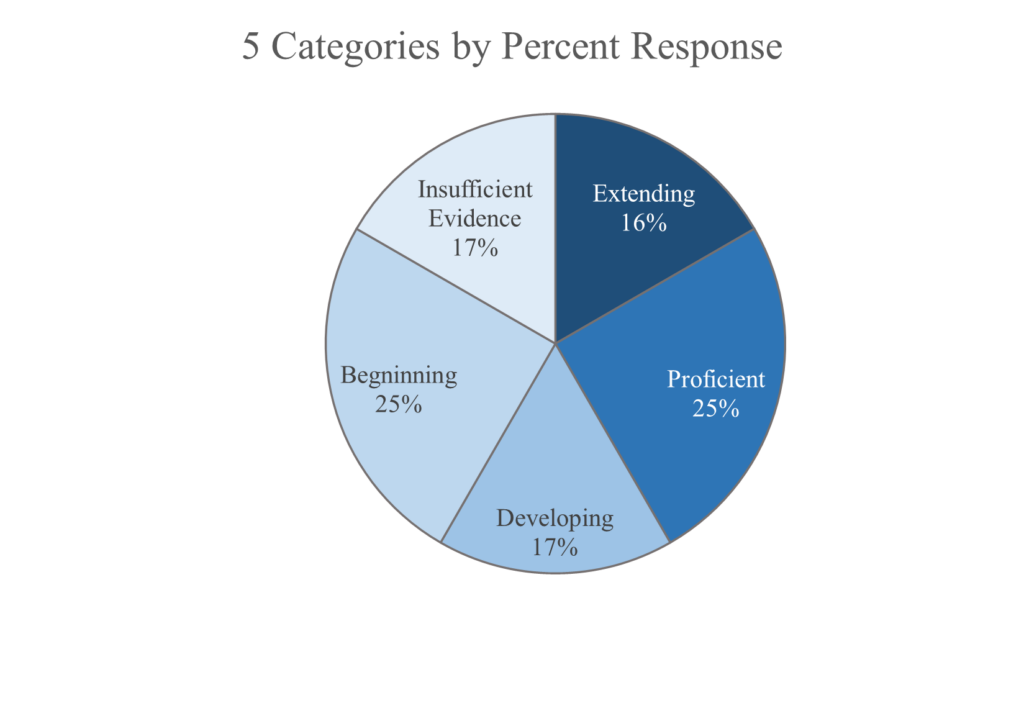
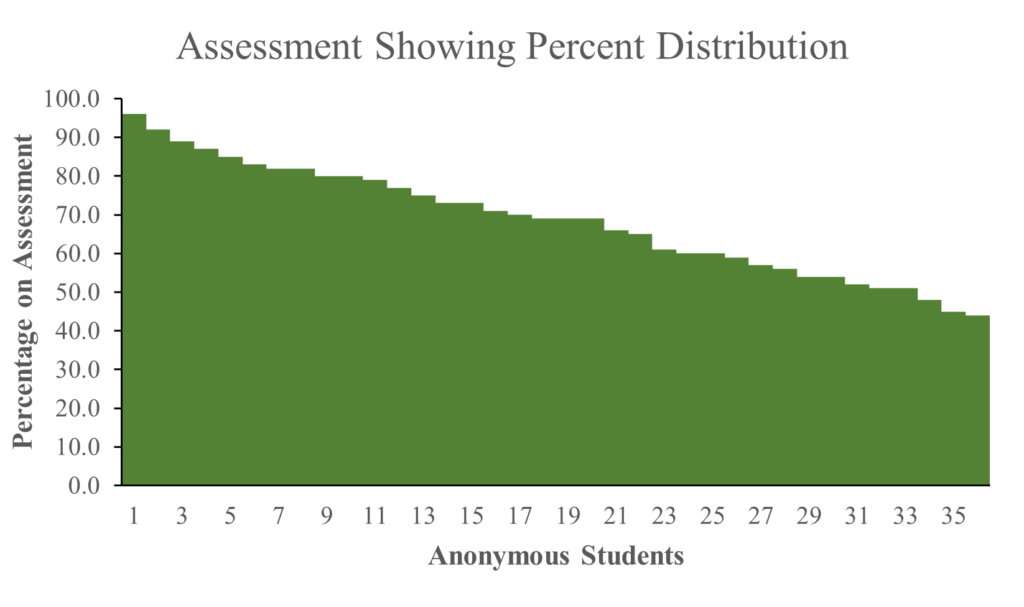
In October, I was able to attend two of the Provincial Specialist Associations (PSA) professional development days where I learned of some useful tools and ideas for collecting ongoing formative assessments in science classrooms. One of the strategies used by the presenter was to collect student data, such as qualitative self assessments where students report how comfortable they are with particular laboratory skills, and then present the data as graphs to the class. This data collected could be collected several times throughout the unit or semester so students could visually see tracked growth. In addition, the act of taking student responses and turning them into something tangible creates more engagement from the students when they see you are taking their input seriously. During the following Pro-D, I spent my time creating a user friendly excel template where class quantitative or qualitative data could be easily inputted, and an assortment of graphs would output; this is one example of a tool I created and shared back (see examples of graph outputs below).